Bay Area Cross Country Coaches, Parents and Fans,
I am the parent of some cross country runners at Archbishop Mitty in San
Jose. When they got started with the sport, I began to keep their personal
times from each race as a way to motivate them and track their progress.
Being an avid fan of kids’ sports, and a bit of technologist, what started
as a simple spreadsheet, turned into a very comprehensive high school cross
country statistics package, which is described below. Information about
these stats reports are being posted here to see if this can be of value to
other schools. Please read about the reports and contact me if you are
interested in seeing how your school can use them. My contact info is
below.
Cross country is a unique sport at the high school level. It attracts the widest possible range of athletes, from incredible runners to those who are competing in sports for the first time. The motivation of the athletes runs full circle too, from those who can set goals and motivate themselves to others who need more external direction. The beauty of cross country, is that whoever the athlete and whatever their motivation, everyone can participate and everyone can succeed. This is where the statistics come in. Coaches and parents can help kids set goals and motivate them to achieve them – if they have easy access to their past performances and other statistical measures. The adage, “if you can measure it, you can improve it” applies to cross country. And by measuring past performances of the team, not just individuals, the stats help build camaraderie and encourage the greater goal of helping the school succeed. In addition, when the reports are given wide distribution and visibility within the team, successes can be shared, which helps build a spirit of success which is contagious.
The remainder of this document describes the statistics that are computed in the reports. If you coach a team or if you’ve ever tried to assemble cross country stats, I think you’ll find this interesting. The next paragraphs example portions of the stats report. You can download a full sample report here.
Meet Summary Information
The section to the right displays the results of a completed race. In the section marked "1", the basic information is shown (time, pace) and the rank of finish based on the entire field, the school and the division. Coaches can easily see the top runners regardless of division, so to understand if the teams need to be shuffled. Each runner can see their All Time Rank as a result of this race (this is the overall rank of their best time based on school history, whatever is known). Also if a Personal Record is achieved it is celebrated.

Under the heading of Previous Personal Record (shown with a "2"), this section shows each runners previous record for that course, their time, pace and rank. These fields are displayed for each course to be run that season, so the runners can see their PR’s prior the race. After a given race is run, these fields do not change, so the runner can refer back to their best time and rank before the race and after.
Team Results
Team results are critical to build camaraderie and cooperation amongst the team. In the view below (show with a "3"), a wide range of team results are shown, including overall team time, time and pace of the 1st and 5th place runners with comparisons to the top finishing teams at the meet. This is shown for each division. The top 3 All Time team times and pace are also shown as a way to motivate this seasons team to beat previous teams.
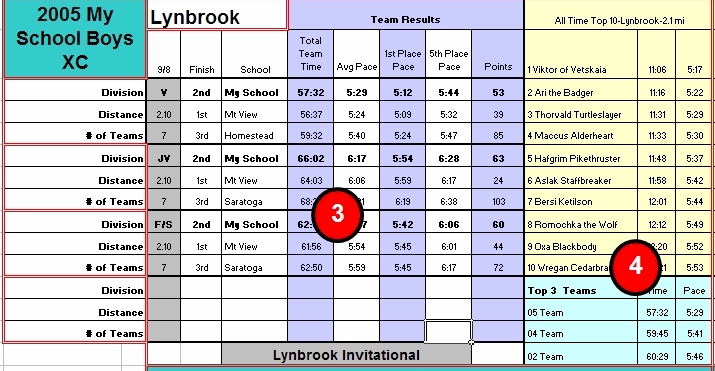
Finally the top 10 runners of All Time are shown for each course (section 4).
Upcoming Meets
For all upcoming meets, only the columns showing the previous personal bests and rank are shown.

Season/Career Totals
At the end of the report is the summary page. See section "5" below. This is rich with summary information about this season, and if the data is available, the past seasons that the runner has participated in. The key columns are the average finish within the division and school. Also we calculate the total number of PR’s the runner has set this year, based on how many PR’s are possible (the first time the course is run doesn’t count as a PR).

Also we display the average pace for every year the athlete has participated in cross country. In the area above (shown with a "6"), we display the fastest runners of all time at the school, based on a minimum number of races.
Example of the whole sheet.
You can see how all the pieces fit together in a full report, by clicking here.
Contacting me
I am happy to hear from any coach or parent on whether they find this useful and if they are interested. Please just contact me for an open discussion about the usage. Mike Sherwood (msherwood@sbcglobal.net)